
Course·Beginner·6 lessons·89 minIN PROGRESS
GDB from zero to hero
GDB is very powerful, by default it doesn't do much. This course takes you from 0 to fully configured. You will learn: what a debugger actually does to a running process, how to set one up so it is pleasant to use, how to reach into a process that is already running, and how to teach it commands of your own.
Start lesson 01 →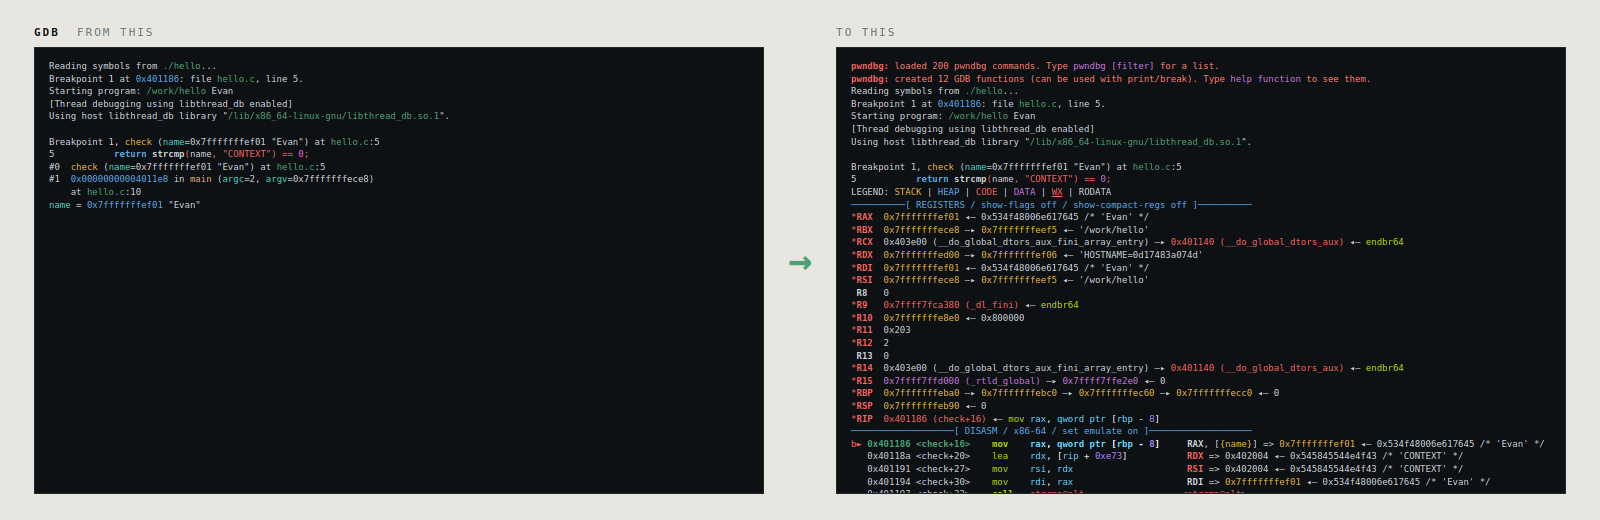
Outcomes
- Set breakpoints, step through code, and read a backtrace
- Configure GDB so it is worth using every day rather than once a year
- Explain what a breakpoint physically is and why a debugger can stop a program at all
- Attach to a process that is already running, and detach without killing it
- Add your own commands to GDB, in its own scripting and in Python
- Run pwndbg, and read the context it prints on every stop
- 01✓ Done12 minGetting started with GDBInstall GDB, build an example, and get a real breakpoint on the board in about five minutes.
- 02✓ Done12 minBasic configThe .gdbinit that makes stock GDB worth opening, the TUI, and why attaching to a running process fails on a hardened box.
- 03✓ Done17 minHow debugging actually worksA breakpoint is one byte of your program overwritten with 0xcc. Here is the proof, and why the debugger hides it from you.
- 04✓ Done18 minAttaching to something already runningReach into a process that is already running, read its state, change it, and let it carry on.
- 05✓ Done16 minTeaching GDB new commandsTurn the commands you keep retyping into commands of your own, first in GDB's own scripting and then in Python.
- 06✓ Done14 minAdvanced config: pwndbgpwn GDB's interface with one that shows you registers, disassembly, source and stack on every stop.